High mountain of asia heavily depend on glacier for water security, therfore understanding long-term evolution of groundwater storage (GWS) is crucial. This study uses remote sensing, earth system modeling and AI for historical and future evolution in ground water storage in this critical region.
Assessing groundwater sustainability acrocss high mountain asia using remote sensing
Meltwater from glaciers contributes to the volume of streamflow of the rivers in this region. However, groundwater provides buffer against seasonal and interannual variability in streamflow.
Study Area
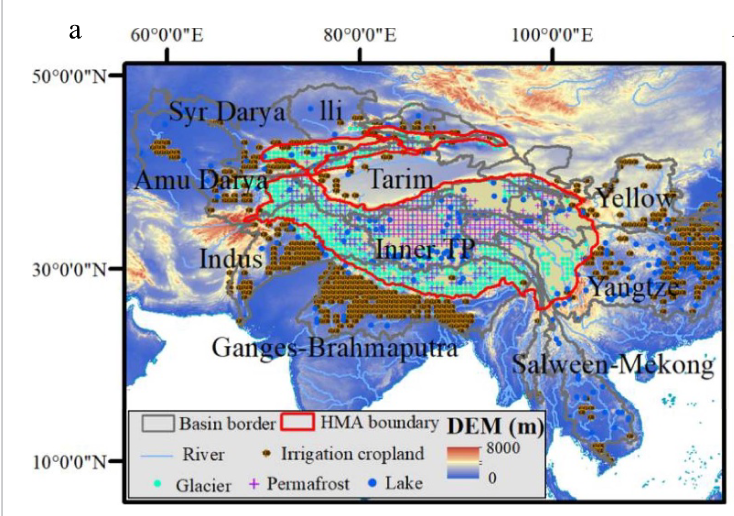
In this study Tibetan Plateau, The Himalayas, and The Tianshan Mountains are considered as High Mountain Asia (HMA).
What is the issue?
- Disrupted recharge-discharge processes
- Weakened the connectivity between surface and subsurface hydrological systems
Situation’s worseing - How?
- Climate change ( glacier retreat, permafrost degradation, high-elevation lake expansion, precipitation anomalies, and heatwaves)
- Human factor (Overextraction for agriculture, industry, and domestic use)
Why this study is needed?
- Insufficient investigation of groundwater storage in the region; most studies focus on terrestrial water storage
- Limited in situ observations
- Complex subsurface hydrology that is difficult to simulate
- Challenges in predicting the future of groundwater storage (GWS)
Tools used
- Remote Sensing
- Gravity Recovery and Climate Experiment (GRACE)
- GRACE Follow-On (GRACE-FO)
- Artificial Intelligence (AI)
- Transformer
- Earth System Models (ESMs)
- Multi Model Ensemble (MME)
Problem with tools used
GRACE and GRACE-FO measures the change in gravity. Because water has mass, when it moves, the Earth’s gravity changes slightly. But there are two big hurdles:
Math is hard: Different ways of calculating the satellite data (like “spherical harmonic” vs. “mascon”) can give different answers.
Too many moving parts: In the mountains, it’s hard to tell if a change in gravity is from a melting glacier, a growing lake, thawing permafrost, or actual groundwater.
How this study overcomes the problem?
The study addressed these challenges through three key integrations: remote sensing, Earth System Models (ESMs), and AI techniques.
-
Build a Better Map (2003–2020): Satellite observations were combined with land surface models to develop a reliable historical reconstruction of groundwater change over the past two decades.
-
Use AI: A Transformer model (the same underlying technology used in systems like ChatGPT) was applied to attribute groundwater loss, distinguishing between climate-driven and human-driven causes.
-
Predict the Future: Eight different state-of-the-art climate models were used to project groundwater conditions through the year 2100.
The Big Assumption: Future projections assume that human groundwater use will continue at the current rate.
Under all of this, the study employed a Multi-Model Ensemble (MME) approach — a combined framework integrating outputs from eight different Earth System Models (ESMs).
Methodology
- How GWS changes over time is calculated:
\(\frac{dGWS}{dt} = \frac{dTWS}{dt} - \frac{dC}{dt} - \frac{dSWE}{dt} - \frac{dSM}{dt} - \frac{dG}{dt} - \frac{dPM}{dt} - \frac{dL}{dt}\)
- where : TWS= Total Water Storage, C= Canopy water, SWE= Snow Water Equivalent, SM= Soil Moisture, G= Glaciers, PM= Permafrost, L= Lakes
GRACE satellites detect gravity change, which reflects the combined mass of all water.
So researchers first estimate:
\(\Delta TWS \; (\text{Total Water Storage Change})\) – Mascon = Mass Concentration blocks: Instead of representing Earth’s gravity using mathematical waves (spherical harmonics), the mascon method divides Earth into grid-like blocks and estimates water mass change in each block directly.
This is important in High Mountain Asia, where terrain is complex.
Two major research centers process GRACE data independently:
- Center for Space Research (CSR)
- Jet Propulsion Laboratory (JPL)
Because no single dataset is perfect, researchers average them:
\(TWS_{\text{mean}} = \frac{TWS_{\text{CSR}} + TWS_{\text{JPL}}}{2}\) – This is similar to a multi-model ensemble approach, but for satellite products. Why averaging is done: Reduce dataset-specific bias, Minimize processing uncertainty, and Improve robustness of results
- Missing data filling:
- GRACE time series (April 2002 to June 2017) instrumental interruptions: derived from linear interpolation.
- Between GRACE and GRACE-FO (July 2017–May 2018): TWS reconstructed - data-driven gapfilling model
Findings
- about two-thirds of HMA experienced declining GWS over the past two decades, with the most losses concentrated in heavily populated and irrigated downstream basins such as the Ganges–Brahmaputra, Amu Darya, and Tarim.
- Overall, approximately 69% of land area in HMA experienced declining GWS trends, with the most losses occurring in densely populated and agriculturally intensive downstream basins.
- Decline indicates the vulnerability of downstream water systems, where storage and recharge is increasingly insufficient to offset intensive extraction and evapotranspiration losses.
- Endorheic sub-basins within the interior Tibetan Plateau, particularly areas such as Hoh Xil and the Qiangtang Plateau, exhibited positive GWS trends.
- GWS in HMA exhibited pronounced heterogeneity shaped by both climatic and human drivers.
- climatic drivers (i.e. precipitation, air temperature and shortwave radiation) accounted for approximately 47% of GWS variability.
References:
footnotes:
- ESMs (Earth System Models): massive, incredibly complex computer programs that simulate the entire planet. They don’t just look at the weather; they calculate how the atmosphere, oceans, melting ice, and plants all interact with each other.